![[PRO] Company Starter Kit](https://design.rip/uploads/cover/blog/company-starter-kit.webp)

![[VIP] Uicon V1.0 / Animated Icons](https://design.rip/uploads/cover/blog/uicon.webp)

![[VIP] Talkative Brand Book & Style Guide](https://design.rip/uploads/cover/blog/talkative-brand-book--style-guide.webp)
![[VIP] UX Stack Guru](https://design.rip/uploads/cover/blog/uxstackguru-bwikur.webp)
![[VIP] The Professional Style Guide Kit](https://design.rip/uploads/cover/blog/the-professional-style-guide-kit--indesign-format.webp)
![[LS] iPhone 14 Pro Longscroll Mockups](https://design.rip/uploads/cover/blog/iphone-14-pro-longscroll-mockups.webp)
![[LS] Acryl Abstractions](https://design.rip/uploads/cover/blog/acryl-abstractions.webp)


![[VIP] PАТАТА SCHООL: 2D to 3D Grease Pencil in Blender](https://design.rip/uploads/cover/blog/patataschool-blender-grease-pencil.webp)
![[VIP] The curious craft of demo reel titles](https://design.rip/uploads/cover/blog/the-curious-craft-of-demo-reel-titles.webp)
![[VIP] DesignCode: Build Beautiful Apps with GPT-4 and Midjourney](https://design.rip/uploads/cover/blog/designcode-gpt4.webp)
![[VIP] AppCoda: Mastering SwiftUI - Professional Packet (Updated 04.2023)](https://design.rip/uploads/cover/blog/appcoda-mastering-swiftui-professional-packet-worth.webp)
![[VIP] AppCoda: Beginning iOS Programming with Swift (Updated 04.2023)](https://design.rip/uploads/cover/blog/appcoda-beginning-ios-programming-with-swift.webp)


![[VIP] Whoooa! 156 vector Lottie animations](https://design.rip/uploads/cover/blog/whoooa-156-vector-animations.webp)
![[VIP] Design+Code: Learn to design and code React and Swift apps [2017-2023, ENG + Sub]](https://design.rip/uploads/images/202312/image_430x256_658ccc86afe53.webp)


![[VIP] Motion Sound Vol. 1](https://design.rip/uploads/cover/blog/designrip-svx.webp)
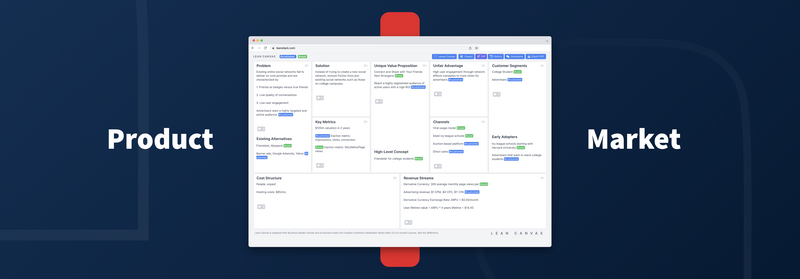
How to manage UX in a startup
Realised that many UX/UI/product designers know the basics of the design process, but don't always understand how to combine activities to get the desired research result. Most importantly, they don't always understand what artefacts will appear in a particular study and how to use the results to improve the product after the study.
Realised that many UX/UI/product designers know the basics of the design process, but don't always understand how to combine activities to get the desired research result. Most importantly, they don't always understand what artefacts will appear in a particular study and how to use the results to improve the product after the study.
In general, it's easy to work when you have someone more macular on the project telling you what to do, or better yet, laying out a roadmap for the project. But very often there are situations when you are the only designer on a project, or the picture of the world has not yet formed and you don't know HOW to do the activity, or you worked on a big project and now you are in a startup, where the rules of the game are completely different and you need to somehow cope with the design quickly and qualitatively.
So, let's break down what to do if you're in a startup and want to bring irreparable value to the product.
We all already know that in order to improve the user experience of a product, there are many UX techniques. There are so many that it's easy to get confused. In my opinion, the cool analogy here is going to a ? restaurant
For example, you walk into an establishment and see a bunch of obscure accessories. On the tables are various coffee and dessert spoons, ice and asparagus tongs, small and large pastry tongs, and various spatulas (pate, fish, ice cream or caviar). It all looks impressive and incomprehensible.

On the one hand, you can learn it all, but it takes a long time to learn, and often people have never used a pate spatula in their entire lives ?
Similarly, a normal designer can't know all the techniques well and be able to perform all the actions, because it's simply physically impossible to learn everything. And often projects simply don't require a particular niche or transit activity.
On the other hand, "An Expensive Spoon to Lunch" - it is advisable to know what to use and when to use it.
And on the other hand, there's the possibility that the designer has caught the Hot Hand phenomenon on a dare and is stretching his or her usual design process across all projects. Thoughtlessly and without understanding if this is necessary for the project, what benefit does it provide?


NOTES:
Hot Hand Syndrome was first articulated by Ben Cohen in 2020 in his book Hot Hand: Mystery and Scientific Controversy Over Serial. To summarize the essence of this syndrome, it is the player's belief that he is omnipotent when he has "caught the craze". It's like the laws of physics have changed for him and he can do anything. This cognitive distortion does not only exist in basketball and can be experienced by anyone when they "catch a buzz". This is a very dangerous byes that can cause a designer to run any project through the usual divergent-convergent process, use the same activities, and hope that everything will be SUPER as usual. ?
So, let's imagine that you are a designer who has been outsourcing for a long time and has come to a product. What activities would be relevant and most useful in this case? Sure, you can do all the activities in the world, from stakeholder mapping to diary research to cohort analysis. But are all these activities equally useful! Will your stakeholder want to pay for all these activities!!!! Let me remind you again that in any case the beneficiary and the person who will pay for your work will be the stakeholder - your client. Therefore, it is advisable to be able to choose your activities. Again, this is where the "Method - Reason - Price Approach" comes in handy.
You will most likely have to choose what you want to use in your work, what activities will give you the most value and help your business maximize its effectiveness.
So, let's walk through the activities that need to be accomplished in your startup. Of course, this might be my subjective opinion, but if you have anything to add, feel free to pop into the comments and give your opinion ?
At the very beginning, let's agree on which product can be considered a startup and which can be considered an adult macure giant. Personally, I've heard several classifications:
- On launching a product on Inintial Public Offering (IPO) If a product has not yet gone public, it is a startup, but if its shares have already been issued and sold to all comers, it is already a "biggie" ?
- It's more vagueon the number of employees here: if you're a startup, you have few people working for you, and if you're a mature product, you have a lot of people working for you. How much is "a lot" and how little is "a little" - fuck knows.
- If you've been in the market for a short time, you're a startup, but if you've been in the market for many years, you're a mature product.
- By the amount of investments attracted/profits received, etc. Also vague categories. After all, there is no telling how much investment or profit is needed to move to a "grown-up product".
Personally, I don't care exactly what you call your product - "startup" or "adult macura giant". For myself (and let me remind you that I am a designer and so I look at the classification solely from a designer's perspective) , I defined as a "startup" any product where the designer needs to think about what to do, what activities are needed here/now, and most importantly, needs to "sell" this activity to the stakeholder. In order for him/her to agree to use your time for this particular proposed UX activity.
If we accept the difference between a startup and a product, we can easily conclude that in a startup the designer has more commitment, higher level of responsibility and more influence on the final result. Of course, if the stakeholders/owners of the startup are adequate people and are willing to listen to the employee ?.
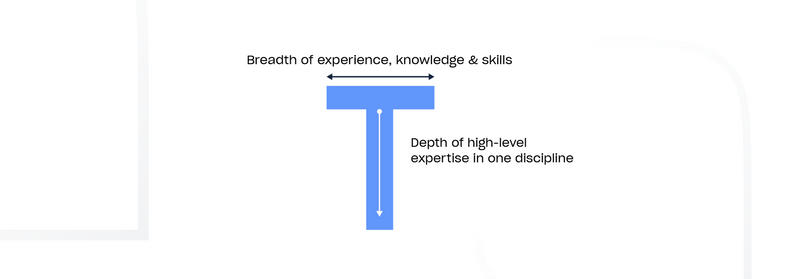
And of course, when you work in a startup, you're much closer to the stakeholders and the business itself. Therefore, it is necessary to meet the needs of the business, understand them and think not only about the user (here again the statement that "the designer is the user's advocate" comes to mind), but also about the business. That is, in a product/startup, the designer must cover all three points of Norman's stool. And in order to cover business acquisitions, it is advisable to understand what exactly and how a startup sells, what it earns on, where the margin is, what its revenues and expenses are, and sometimes to shoot off the "pink unicorns" of stakeholders when they start spouting unsupported product hypotheses. This is a great opportunity to grow into a T-shaped or Paint-Drip specialist.
So, let's cut to the chase. What design activities (beyond standard activities such as User Interview, User Persona, CJM, and others) would most benefit the startup?
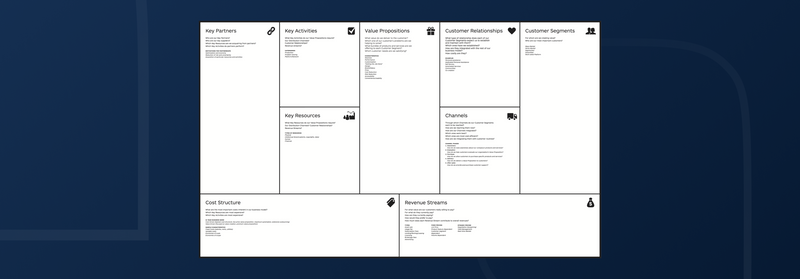
Business Model Canvas (hereinafter referred to as BMC)
BMC is one of the tools for describing, visualizing, evaluating, strategically managing and changing business. This canvas was developed by Alexander Osterwalder (Strategyzer) in 2005 as a template to describe a business. In essence, a BMC is an abbreviated spreadsheet that outlines basic information about a business, its major components and business processes. This saves a lot of time and makes it easier to understand the business, because when filling out a CPA, you don't have to climb through a lot of different documents (business plan, strategy, various design artifacts, design offices, etc.) to find the right information.
The canvas is a table consisting of 9 blocks logically divided into 4 groups:
1- Infrastructure - this describes how a company produces a product or service that is then received by the customer. This group consists of the following units:
- Key Activities - describes the most important measures by which a company can build its business model;
- Key Resources - describes the most important assets needed to make the business model work;
-
Partner Network - describes the network of suppliers and partners that help the business model to function;
2.Offer - here is a description of the product itself offered to customers. This group consists of a single unit: -
Value Proposition - describes a package of products and services that provide value to a specific customer segment.
3.Customers - here the business is described in terms of its target audience and methods of interaction with them. The group consists of the following units: -
Customer Segments - identifies the different groups of people or organizations that a business seeks to attract and serve.
-
Channels - describes how the company interacts with customer segments to offer and deliver a value proposition.
-
Customer relationships describe the types of relationships a company establishes with specific customer segments
4.Finance is a description of the financial side of a business. It consists of the following blocks: -
Cost Structure - describes all the costs required to run the business model.
-
Revenue Streams - includes the funds that the company generates from each customer segment (you have to subtract expenses from revenue to make a profit)
The classic CPA often gives a sequence for filling out the template, but in reality the most important thing for filling out the canva is to get up-to-date and complete information about the business. How you fill it out is secondary. In addition, if you are completing the canvass during a stakeholder orientation meeting (called a kick-off) or during a stakeholder workshop, it is often difficult to keep the order of the canvass in order because your client may not have a clear structure of information in their head. So don't be afraid to deviate from consistency, but be afraid of not getting important information.
It is very important to understand the value of BMC for your project (in our case a startup). The main value is in aggregating all the basic information in a super abbreviated form on a single sheet of paper. Already at this stage you will be able to solve 2 problems:
- Talk to your companions about the main things in the company, thereby reducing misunderstandings;
- See obvious problems in business planning/structure/strategy.
If you additionally triangulate BMC with other studies, it will be generally awesome ?
BMC is most often drafted by a business analyst and a designer. If you're a junior or middle designer, it's advisable to be able to at least read Canvas and know how to work with it.
You can read more about Navy in the book "Creating a Business Model" by Yves Pignet, Alexander Osterwalder.
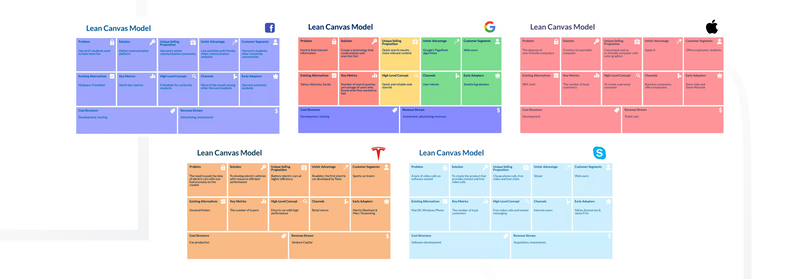
Of course, the best way to understand canvases is through practice, but if you don't have that experience yet and you want to learn how to work with BMC, you can look at examples of completed canvases for world-famous brands.
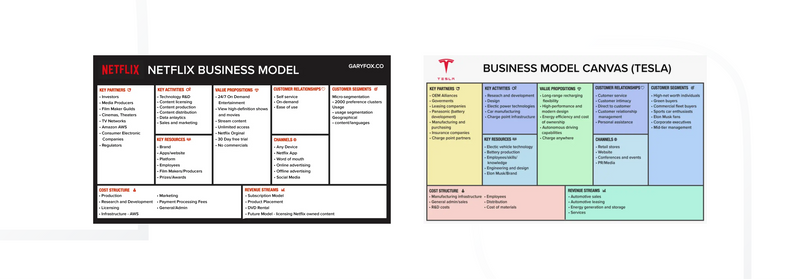
And Business Model Canvas is cool to everyone, but it has one big downside - it's cool for describing real businesses (coffee shop, grocery store, etc.), but for digital products it's no longer super-cool and has some drawbacks. In order to customize BMC for digital products (especially in the startup phase), another Lean Canvas was put together.
Lean Canvas (LC)
LC is a one-page business description template that was developed in 2010 by Ash Morilla as an adaptation and optimization of Osterwalder's Business Model Canvas, but for startups and more digital products.
The main advantages of the LC are:
- Speed - Unlike writing a business strategy, a business plan, which can take weeks or months to complete, a letter of credit can be completed within a day. This is done especially quickly through a workshop with stakeholders.
- Ease of use (portability) - Obviously, a one-page artifact is easier to share with colleagues and thus understand important aspects of the business.
- Conciseness - LC allows you to quickly emphasize what is important and explain everything to the stakeholder in a few seconds. Everything is thesis-driven and as clear as possible.
- Efficiency - Canvas makes it quick and easy to present and track progress. Like the Business Model Canvas, the Lean Canvas is a kind of graphical canvas that you can fill out to quickly map out your business and quickly understand all the advantages and disadvantages. LC is made up of 9 blocks, some of which have additional blocks - so the total of all the blocks is 12 blocks and describes ALL about business!
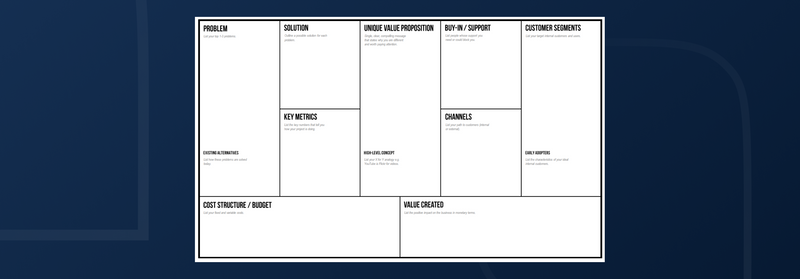
Lean Canvas Blocks:
- Problem - The target audience you plan to work with will have a specific set of problems they want to solve. Therefore, in the appropriate block, you need to specify 1 to several problems of your target audience that you want to solve with your product. It's hard to imagine that a product can be successful and needed if you haven't found the needs and problems of your target audience, so this is a very important block!
- Existing altern atives - this is where you describe what alternatives there are in the marketplace that your target audience can use to solve their problems. This iswhere the Direct and Secondary Competitor Analysis comesin handy.
- Solution - This block best explains the very essence of Lean Startup - the solution to your target audience's problem should be written down here. Usually, if that solution doesn't lie on the surface, it has to be arrived at. It is very timely to recall a statement by Steve Blanks (the godfather of lean): "To understand it, you have to go outside." What you need to do is Get Out The Building). You have to get out of the office to understand the solution, because it would be categorically wrong to work in a vacuum - you have to go to people and ask questions.
- Key met rics - here you describe what metrics you will measure to capture the dynamics of product development. We will return to the metrics issues a little later in this article.
- Unique Value Proposition - UCP is probably the most important LC block as it shows your product's promise to satisfy the user's pain. This is the main reason why the target audience will buy the product from you and not from your competitors. Of course, this block must be filled!
- High-level concept - In this block, you place a specific phrase/sentence/expression that you can use to briefly describe your UCP. Then it can even become the tagline for your product. The key here is to concisely and clearly show what your product is about. Examples of such high-level concepts of well-known products are: "The smartest way to get around" - UBER "Experience is the product" - Apple iPhone "Work more productively with less effort" - Slack
- Unfair advantage - in this block you capture those advantages of the customer's company that are difficult/impossible to take away or copy. These can include various advantages: technical (for example, your product is written on some very cool technology), human (for example, you have a powerful team of designers, analysts and managers who are skillful in working with product hypotheses), business (you have partnership agreements with suppliers, official representation, the ability to dump the market, having a high margin) and others (for example, your product is a monopolist in the market, or has been working for a long time, or got a large base of counterparties).
- Channels - this block displays information about how exactly you will interact with your target audience. What communication channels will you use? Lean involves a fast, continuous Create/Measure/Learn cycle, so in order to get constant and fast feedback from your target audience, you need to understand the channels through which you can communicate with people.
- Customer segments - in this block, it is important to describe your target audience whose problems you will be solving. Without understanding your user it will be difficult to make a successful business, so even if you are using Jobs To Be Done, understanding who your user is should be so! It's also important to realize that even if your steakhold knows best who needs his product, it's not unreasonable to test his hypothesis, because a proto-stakehold won't do you much good.
- Early Adopters - here you describe the category of users who will be the first to use your product and actually become your evangelists and like-minded users. Of course, if they like you? But if you do well, you'll have real fans - you'll be promoted everywhere.
- Acost structure is like a BMC - you describe the cost to the company of running its business.
- Revenue Streams - Similar to BMC, describe the main sources of revenue.
It is also worth noting that if you fill in the ditches at the initial stage, you are likely to get a proto-canvas. That is, this artifact will not correspond to reality 100%, because it will be the vision of stakeholders. And if no activities and research has been done beforehand, it's only your client's vision and it could be very far from the truth.
Again, here are some examples of filled canvas of well-known brands.
Value Proposition Canvas (VPC)
VPC is another painting by Alexander Osterwalder. It was first developed in 2008 as an add-on to BMC, with which you can monitor whether the product covers the requirements of the target audience.
Benefits of VPC:
- Accurately identify product user profiles - with VPC, it's easy to capture the pains, tasks and challenges users face when trying to accomplish their tasks, and the benefits users receive.
- Visualize the value created by the product - the canvas describes the most important components of the user side: tasks, pains, and customer preferences.
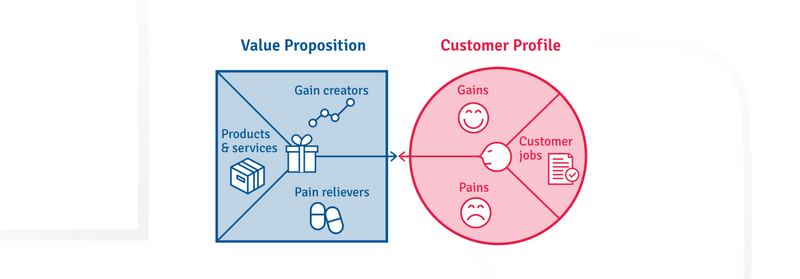
- Achieving product market relevance - the artifact makes it fairly easy to adjust the product offering based on the information that has been gathered from customers and achieve product market relevance. The VPC consists of two parts: the customer profile and the value map. So, let's look at each of these parts individually.

A customer profile reflects a specific segment of users in a structured and detailed way. It is divided into 3 segments:
- Client Objectives - reflects what clients are trying to achieve in their work and in their lives.
- Pain - poor results, risks and obstacles associated with client performance.
- Benefit - describes the results customers want to achieve or the specific benefits they expect.
In turn, a value map (or value proposition map) describes the features of a particular proposition in a structured and detailed way. It breaks down the value proposition into 3 segments:

- Obviously, the list of goods and services reflects all the goods and services that make up the value proposition.
- Benefit creation describes exactly what your target audience gets from your product's products and services.
- Painkillers - the way your products and services "soothe the pain" of customers - solve certain problems.
As with the business model canvas and lean manufacturing canvas, the value proposition canvas can be filled in by stakeholders in a workshop format, but, again, it will be a proto-canvas. In order for Value Proposition Canvas to become a true artifact that will show all the necessary and important aspects of your product, you need to conduct a series of user interviews that validate the user segment and provide a complete understanding of what services, benefits and pain relievers your product lacks to fully satisfy the request of your target audience. This is where the User Empathy Map can come in handy, by the way.
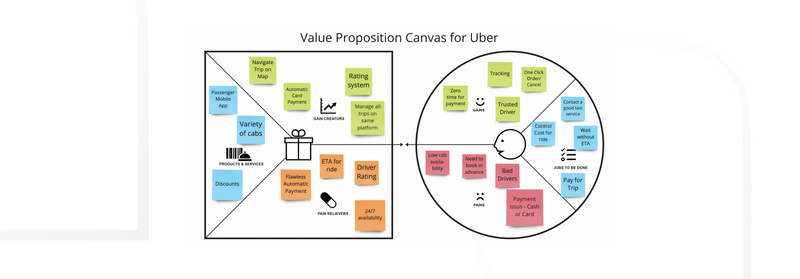
Here you can browse filled canvases for well-known brands.
Unit Economy (UE)
UE is a certain method of accounting, analyzing and planning the financial performance of a digital product. Unfortunately, I have not been able to find when UE was developed, but from my experience I can say that back in 2016 it already existed and was in full use. ?
Unit Economy exists to "bang" the designer and the whole team against reality, to shift the focus from user feelings to numbers that stakeholders love and understand.
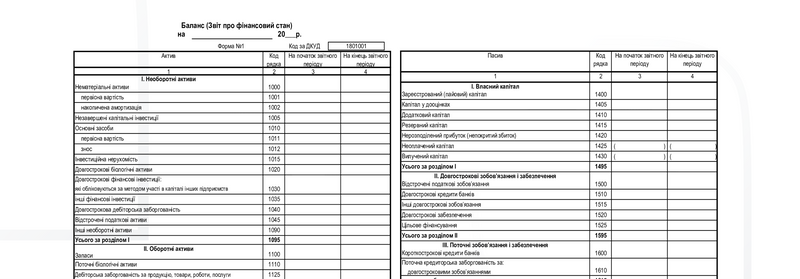
So what exactly is this beast? UU is a specific method of calculating the revenues and expenses of a specific business model (business) in relation to a specific business unit. Of course, for each business, the "unit" will be some basic element that is quantifiable and depends on the business model itself, its monetization and many other factors. For example, for an airline, such a unit will be the airline ticket sold, for a cab service - its load (movement) sold to a customer, and so on. It's actually very simple. If you understand finn. theory a little ,you probably know what a balance sheet is.
Balance sheet (balance sheet) is a report on the financial condition of an enterprise as of a certain date, which shows in monetary terms its economic assets (assets) and sources of their formation (liabilities and equity).
The main advantages of using UE are:
- UE can help you forecast your business revenue. Since UE is pegged to one, it can be used to forecast the profitability of your business (or when it is expected to reach profitability).
- UE can help with optimizing your product. Because UE can be used to determine product reliability, it is possible to determine which product optimization strategies are favorable, determine the appropriateness of marketing expenditures, and so on.
- UE helps you determine how sustainable your product is in the marketplace. In the early stages of launching your startup, UE can help determine the future potential of the product, and as a result, its potential sustainability in the marketplace.
So, the unit economy is an identical concept of balance sheet, but in terms of digital products. It operates with metrics (concepts) such as:
- Lifetime Value (LTV) is the average amount of money you make from one customer over the course of their relationship with you. In SaaS, it's the amount of money you make from the time you sign up until they cancel your subscription and never come back to you. Calculating LTV can tell you a lot about your business, which is why it's one of the most important metrics.
- Customer acquisition cost (CAC) is the total amount of money a company spends on sales and marketing to attract one customer. If you spend too little, you won't get new customers. If you spend too much, you reduce your margins and as a result, you make less profit. Weighted spending is directly related to your LTV, so calculating and understanding your CAC is extremely important.
- Churn Rate or Churn Rate (CR) is the percentage of your customers who canceled their subscription within a certain period. As your startup seeks to grow, it's important to track momentum, so Churn Rate can be an important metric to point out changes in both the short and long term.
- Retention rate or retention factor (R). The retention rate is the opposite of the outflow rate. This is the percentage of customers who return to the product by staying subscribed for a certain period.
- Average Customer Lifetime or Average Customer Lifetime (ACL) is the average length of time a customer remains a user of a product or service. Obviously, the ACL is a key component in calculating LTV.
- Thenumber of customers or customer count (C) is the total number of customers in a product over a period of time.
- Number of Transactions (T) Not all customers are billed at the same frequency, so this metric covers actual transactions made during a given period.
- Total revenue or total revenue (TR) is the total amount of money your product has earned over a certain period.
- Gross profit or gross margin (GP) is the total revenue of a product minus the cost of sales.
- Average order value or average order value (AOV) is total revenue divided by the number of orders (transactions).
- Average gross profit or average gross margin (AGM) is a product's gross profit divided by its total revenue.
There are 2 methods of calculating unit economics:

- Defining a Unit as a "Unit of goods or services sold" In this case, the Profit Margin is calculated by subtracting the cost of sales from the cost of the Unit. UE = Unit Price - Cost to Sell
- Defining a division as "one customer" That is, in this case you no longer tie the calculation to sales, but to the caster itself. In this case, unit economics is calculated as the ratio of customer lifetime value (LTV) to customer acquisition cost (CAC) UE = LTV/CAC
In this case, you need to calculate the LTV. There are also 2 methods of calculating it: predictive and flexible.
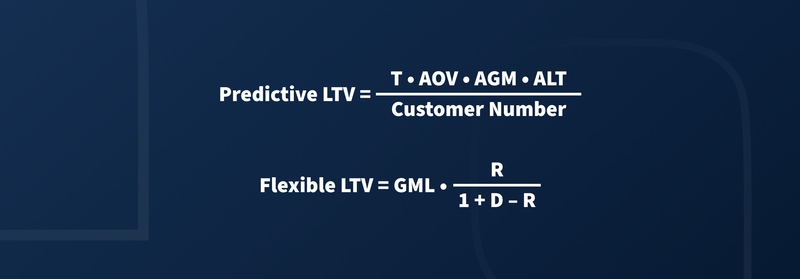
Predictive LTV helps predict customer actions (and therefore revenue) for the future. It is calculated as follows:
Forecast LTV = (T x AOV x AGM x ALT) / number of customers for a certain period
Here:
- T (Average number of transactions): the total number of transactions divided by the specified interval. This way, you get the number of transactions you need in the time period you need.
- AOV (Average Order Value): Determined by dividing the total profit by the number of orders (goods or services sold) - so we get the Average Order Value.
- AGM (average gross margin): To calculate, we subtract cost of sales (CS) from total revenue (TR). The equation will look as follows: AGM = ((TR-CS) / TR) x 100.
- ALT (average life expectancy of the client). ALT is equal to the churn rate (CR - Churn Rate) divided by 1. ALT = CR/1 In turn, the churn rate is determined by comparing the number of customers at the beginning of a given period (CB - Customers at the Beginning of a given period) with the number at the end (CE - Customers at the End). Churn rate = ((CB-CE)/CB) x 100.
Obviously, predictive LTV is aimed specifically at forecasting and predicting financial metrics, but in the case of startups, you need to have a more flexible LTV metric that will react quickly to changes in the market and the positioning of the product in it. This is why there is what is known as "flexible LTV".
Flexible LTV = GML x (R/(1 + D - R))
Here.
- GML (average gross margin per customer lifespan) is the amount of profit your business has made from one customer over the period of time they use your product. Measured by: GML = GM x (TR / C) Here: GM - Gross profit TR - Total revenue C - Number of customers in a given period
- D (Discount Rate): The discount rate measures the rate of return on investment (ROI). This is relevant if your startup has attracted investment.
- R (Retention rate): The retention rate will be described in more detail in the next exercise, but for this formula it is calculated as R = ((CE - CN) / CB) x 100 Here: CB - Number of active users who re-purchased at the BEGINNING of the reporting period CE - Number of active users at the END of the period CN - Number of engaged users.
Also a very important metric of unit economics is cost of acquisition. It shows how much marketing spend is appropriate and how much investment in advertising and other sources involved are doing a good job of generating new leads in your product. CAC is calculated in a super simple way:

CAC = SMC / CN
Here:
- SMC - Sales and Marketing Costs - Sales, Advertising and MarketingCosts
- CN - Number of attracted customers (New Customers) - number of attracted users.
Logically, all of these measurements and miscalculations take time to track over time. And obviously, for startups, the frequency of calculations and measurements should be small enough to react quickly to any market changes.
And logically, if the question "Beardy, that's all cool and interesting, but counting it all with your fingers on a piece of paper? It's hard!"" Of course, no finger pointing or mechanical miscalculations. The usual Microsoft Excel will help you - you just need to set up the document once and it will do everything for you. There you will also build charts and follow the dynamics.
And the miscalculation numbers will be provided to you by the finance department and the most common Google Analytics, so don't be afraid, but rather do the math.
AARRR: Pirate Metrics Framework (PMF / AARRR)
AARRR or Pirated Metrics is a framework for working with behavioral product metrics. It was developed by American entrepreneur and private venture capitalist Dave McClure. AARRR is an acronym that captures the essence of this structure.
Piracy metrics (by the way, they are so called because in movies and comic books pirates shout in a similar way, so the word "pirate" here does not have a negative context) consists of 5 stages of interaction and can be displayed as follows:

Attraction (A) - This interaction stage is responsible for attracting new visitors to your product. This is where you can develop methods that people will use to learn about your service. You may have heard the "7-touch" theory. It is widely used in both sales and politics and states that a potential customer needs to hear about you at least 7 times to remember and become interested. Of course, the number 7 is not a constant, but it shows that attracting new customers is not as easy a task as it seems. And that's exactly what you do at the acquisition stage.
Activation(A) - In this step, you work on activating the user. The main goal of the stage is to turn an ordinary visitor into an active user.
User Retention (R) - obviously, after a certain amount of time, users may forget about your product or service. This is where holding comes in handy, to take the user from sleep mode to active use. After all, as designers, we are not only interested in a great user experience, but also in making a consistent profit. So let's get users back and motivate them to keep using it.
Recommendations or Referral (R) - This stage of interaction reflects how willing users are to recommend you to their friends and acquaintances. It's great when your users are so satisfied that they become committed to your service and promote you on all forums, social media, etc. If so, help them do that and they will attract new users to you through referral programs, referral codes, etc.
Revenue (R) - obviously, this item answers the question "how much users are willing to pay you", how much money they bring in, etc. The previously mentioned Unit Economy will come in handy when working on this step.

For each of the interaction stages I've already told you about (Attraction/Activation/Returns/Referrals/Income), there are 2 important points to work through:
- Themethods by which you will influence a particular stage.
- Metrics that will be used to measure the dynamics of change.

Of course, here the designer's work goes far beyond the usual delivery of paintings. You'll have to work with analytics, track metrics, and respond quickly to changing metrics.
NOTE: it's important to realize that the AARRR framework is cool and can be useful for your startup. But it doesn't work well in isolation from metrics because it requires metric control.
Scheme of Service (SB)
Almost all designers know how to work with user experience using the Customer Journey Map (CJM), which was invented in 1985 by Chip Bell and Ron Zemke. CJM then migrated from marketing to design and is now one of the most popular design activities, and the composite CJM itself is probably the most popular and useful artifact of a UX designer's work.
Obviously, CJM is a mandatory activity by which a UX designer captures the interaction problems between the user and the product. But in a startup, it's important to see the WHOLE picture globally. That is, not only the user's actions, but also the product's actions, because important events can happen under the hood of the service that will affect the user experience. And very often it is the product side that can be the problem. This is exactly the kind of situation that Service Blueprint comes in handy for.

SB is a technique used in service design. This technique was invented and first described in the Harvard Business Review back in 1984 by banker and investor Lyn Shostak. And today this tool, as a complement to the aforementioned CJM, is already being used by UX designers around the world. So, what is this Blueprint Service - let's figure it out together.
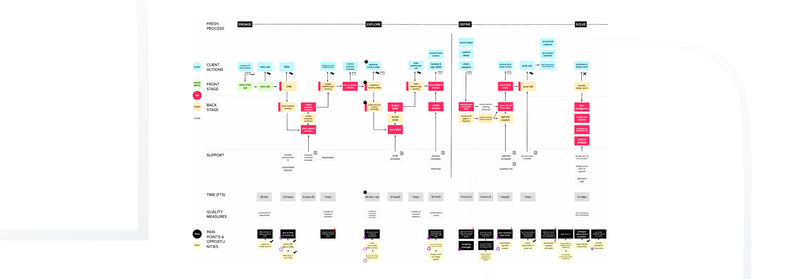
The main advantages of using SBs are:
- It allows you to quickly find product flaws because it takes into account many aspects: interface flaws (bad design, broken button, unclear tooltip, and so on), system problems (corrupted data, long response time, etc.).
- It allows you to find possible ways to optimize. For example, you can optimize your customer's onboarding (partly at signup and partly when they first use the product). Then users will be pleasantly surprised by the care of the product, when it remembers the user and pre-fills some of the data, you will save time on re-collecting user information.
- It brings together the different points of user interaction with a product, and takes into account the different departments of that product. For example, if your product is quite complex and has multiple touchpoints (website, app, real-world touchpoints), the team of employees is divided into a complex hierarchical structure (e.g., there is a separate user engagement department, return department, main interaction department, and many others), then SB will be able to tie all interactions into one mapping method.
As I mentioned above, SB is an extension of CJM. As such, it has several key elements:
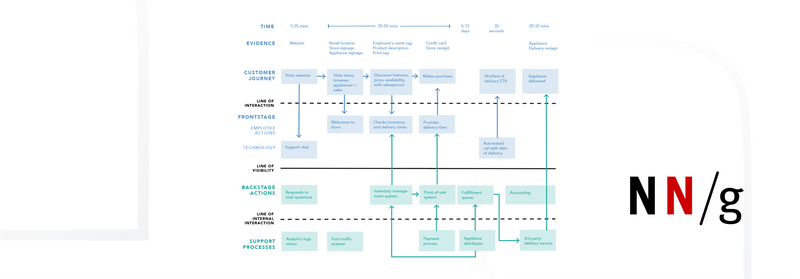
- User Actions It describes the user's actions to complete their main flow in your product. Of course, the main flows can be considered those related to monetization and user engagement. In a classic Service Blueprint, user actions are understood as flows, i.e. steps with your CJM, although in my personal opinion, it is optimal to use the entire CJM on this step as it will give you complete information (i.e. drag more user actions, thoughts, words and opportunities for improvement at each step into your SB). To better understand what I mean, I'll remind you of the official CJM compilation template from NNGroup.
- Frontstage Actions Sori is intended for regular Anglicisms, but Frontstage refers to product actions that the user can see directly. If it is a digital product, human-to-human or human-to-computer interaction can be considered. Person-to-person actions include user interactions with a product contact (e.g., in a restaurant, you interact with a waiter who is a representative of the company). And human and computer actions are obviously interactions with technology (e.g., an app on a cell phone, an ATM, ibox, etc.). For example, when ordering pizza or sushi, you (as a customer) interact with a website or app (where you place the order) and a courier. It's Frontstage - you see the delivery guy bringing you sushi and you see him as a representative of the service.
- BackstageActions In the backstage stage, those service processes that are hidden from the user take place. That is, what the user is unable to see. As if off-screen. In the sushi example, this is processing your order, preparing your set, packing it, etc. You, as a user, guess that someone is doing the work, but you don't know for sure. But if you are a designer in such a product, it is advisable for you to describe these processes as they are available to you. And one more personal lifehack from me: if your project provides a product or service, after you make a Service Blueprint from the words of all involved services, try to use your service as a user. This way, you'll see the flaws personally, because your mates may have lied a bit about idealizing certain processes, and this can affect the user experience, and as a result, the business.
- Processes These are certain additional services and interactions that are used to keep Backstage and Frontstage running. These services can be either internal (in-house) or external. For example, a product may need a marketing department to function properly - it does not directly provide the service, but without that particular department, the product cannot function. This is an example of internal customer service. You may also need a collection service - this service will be provided to you by your counterparty bank, and this is an example of external support.
- Evidence This is definite evidence of user interaction with the company or service, touch points, etc. This includes interaction artifacts (payment receipt, receipt, product request, etc.) and interaction points (website, email, mobile app, etc.).
- Time For each stage of your Service Blueprint, it is advisable to set a time for the user to interact with the product. Of course, if you are just developing a product, this time will be very approximate and calculated theoretically, but if the service is already launched, it is advisable to fix the real time by making periodic test purchases.
- Metrics At each stage of user interaction, you can measure certain metrics that will demonstrate the success of that particular stage. And this is where AARRR comes in handy again.
After mapping your product with Service Blueprint, you as a designer will have as much information as possible about the user's interaction with your product, and therefore I advise you to periodically update the artifacts you've collected after a few completed sprints. Of course, a release doesn't always dramatically change the UX of your product, but when it does, try to capture these changes in an updated artifact so you can compare the dynamics of the changes later. This is why it will be very helpful to have a specific space in your Jira where all the design artifacts you will be working with will be located.

Of course, besides these activities, there are several others (e.g. BPMN-mapping, analyzing trigger mechanics, calculating product and UX metrics and many others) that are worth paying attention to, but for today, I think it's worth stopping ?.
Well, your logical question would be, "If I'm working on a regular outsourcing project, do I need to know and do these activities?". And my answer is simply, "YES." After all, no one is stopping you from providing additional benefits to the project. In general, the product approach is possible on conventional outsourcing projects as well.
What's Your Reaction?