![[PRO] Craftwork Pass 2024.04.24](data:image/gif;base64,R0lGODlhAQABAIAAAP///wAAACH5BAEAAAAALAAAAAABAAEAAAICRAEAOw==)


![[PRO] Company Starter Kit](https://design.rip/uploads/cover/blog/company-starter-kit.webp)

![[VIP] Uicon V1.0 / Animated Icons](https://design.rip/uploads/cover/blog/uicon.webp)

![[VIP] Talkative Brand Book & Style Guide](https://design.rip/uploads/cover/blog/talkative-brand-book--style-guide.webp)
![[VIP] UX Stack Guru](https://design.rip/uploads/cover/blog/uxstackguru-bwikur.webp)
![[VIP] The Professional Style Guide Kit](https://design.rip/uploads/cover/blog/the-professional-style-guide-kit--indesign-format.webp)
![[LS] iPhone 14 Pro Longscroll Mockups](https://design.rip/uploads/cover/blog/iphone-14-pro-longscroll-mockups.webp)
![[LS] Acryl Abstractions](https://design.rip/uploads/cover/blog/acryl-abstractions.webp)


![[VIP] PАТАТА SCHООL: 2D to 3D Grease Pencil in Blender](https://design.rip/uploads/cover/blog/patataschool-blender-grease-pencil.webp)
![[VIP] The curious craft of demo reel titles](https://design.rip/uploads/cover/blog/the-curious-craft-of-demo-reel-titles.webp)
![[VIP] DesignCode: Build Beautiful Apps with GPT-4 and Midjourney](https://design.rip/uploads/cover/blog/designcode-gpt4.webp)
![[VIP] AppCoda: Mastering SwiftUI - Professional Packet (Updated 04.2023)](https://design.rip/uploads/cover/blog/appcoda-mastering-swiftui-professional-packet-worth.webp)
![[VIP] AppCoda: Beginning iOS Programming with Swift (Updated 04.2023)](https://design.rip/uploads/cover/blog/appcoda-beginning-ios-programming-with-swift.webp)


![[VIP] Whoooa! 156 vector Lottie animations](https://design.rip/uploads/cover/blog/whoooa-156-vector-animations.webp)
![[VIP] Design+Code: Learn to design and code React and Swift apps [2017-2023, ENG + Sub]](https://design.rip/uploads/images/202312/image_430x256_658ccc86afe53.webp)


![[VIP] Motion Sound Vol. 1](https://design.rip/uploads/cover/blog/designrip-svx.webp)
[VIP] Baymard Institute: Cart & Checkout Usability Research
69% of all e-commerce visitors abandon their shopping cart. Why? At Baymard we’ve tracked the global average cart abandonment rate for 12 years, and it currently sits at 69.8%.
![[VIP] Baymard Institute: Cart & Checkout Usability Research](https://design.rip/uploads/cover/blog/baymard-research-checkout-usability.jpeg)
E-Commerce Checkout Usability: An Original Research Study
·
At Baymard we’ve tracked the global average cart abandonment rate for 12 years, and it currently sits at 69.8%.
After e-commerce sites have invested vast resources in “first in mind” strategies, Pay Per Click campaigns, beautifully crafted homepage imagery, faceted search logic, etc., it seems almost unbearable that 69% of users – after having added items to their cart – then choose to abandon their purchase.
Why is it that this many orders are abandoned? And what exactly can online retailers do to improve this sad state of affairs? That’s exactly what we wanted to find out.
At Baymard Institute, we started researching checkout usability more than 12 years ago when we founded the institute and did our first round of large-scale checkout usability testing. Ever since, we’ve tested and re-tested checkout usability, running large-scale qualitative research studies testing the checkout flows of the world’s leading e-commerce sites, as well as conducting checkout UX audits for more than 100 leading e-commerce sites.
This page provides you an overview of the results from those years of testing checkout flows with real end-users. All of this research is available as part of Baymard Premium.
·
·
The Current Checkout UX Performance
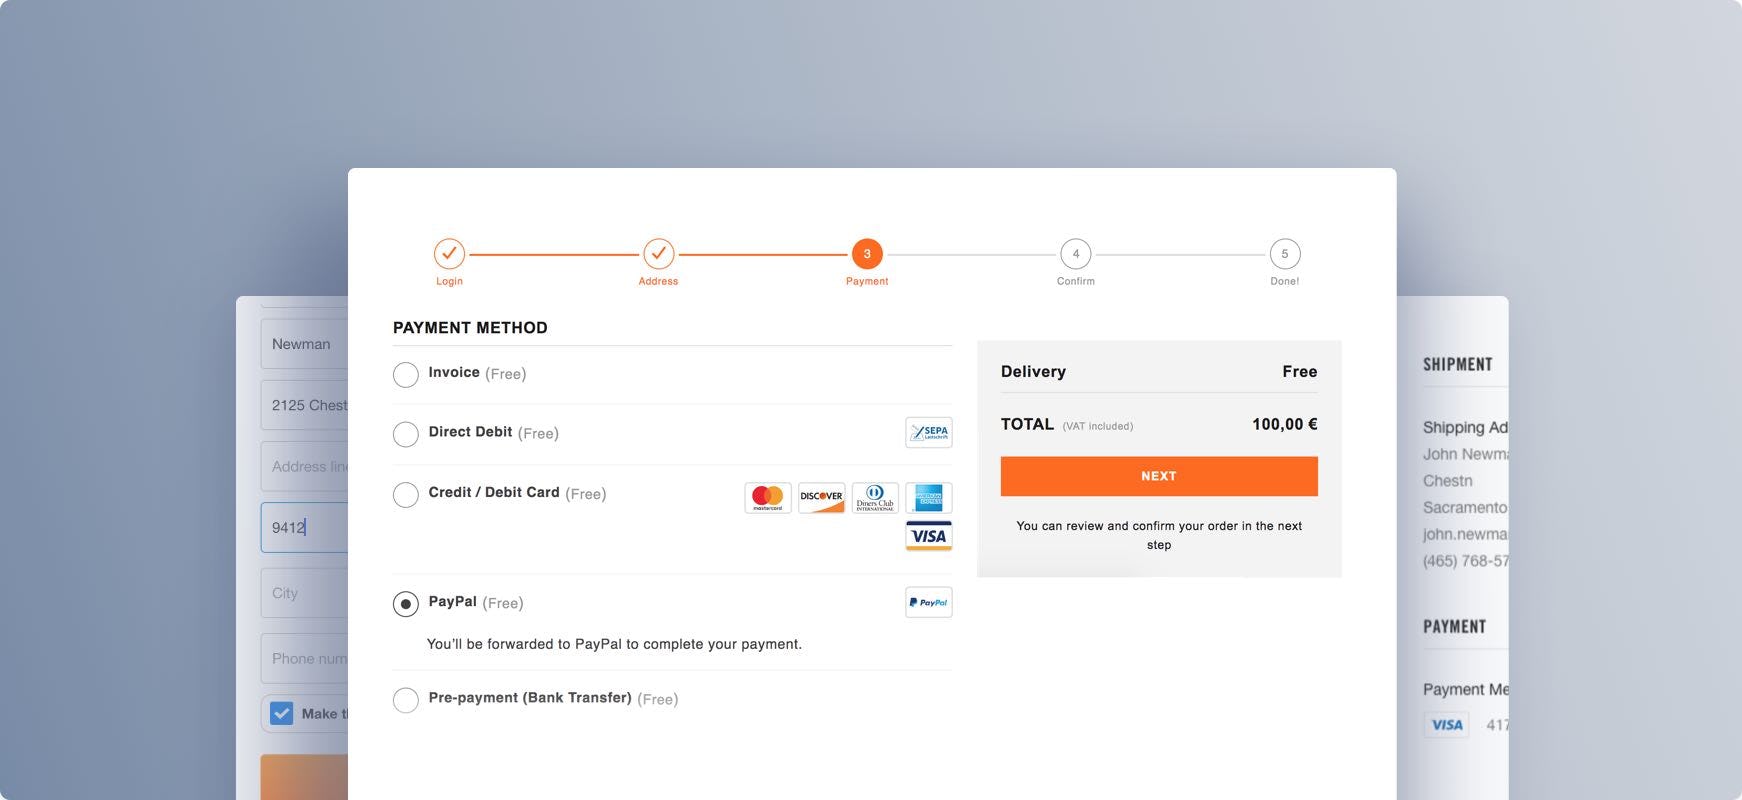
During all 12 years of usability testing we have consistently found the design and flow of the checkout to frequently be the sole cause for users abandoning their purchase during the checkout flow. Either because users become so infuriated that they leave in anger, or because they don’t know how to complete one or more fields, and thus have no other option but to leave.
·
·
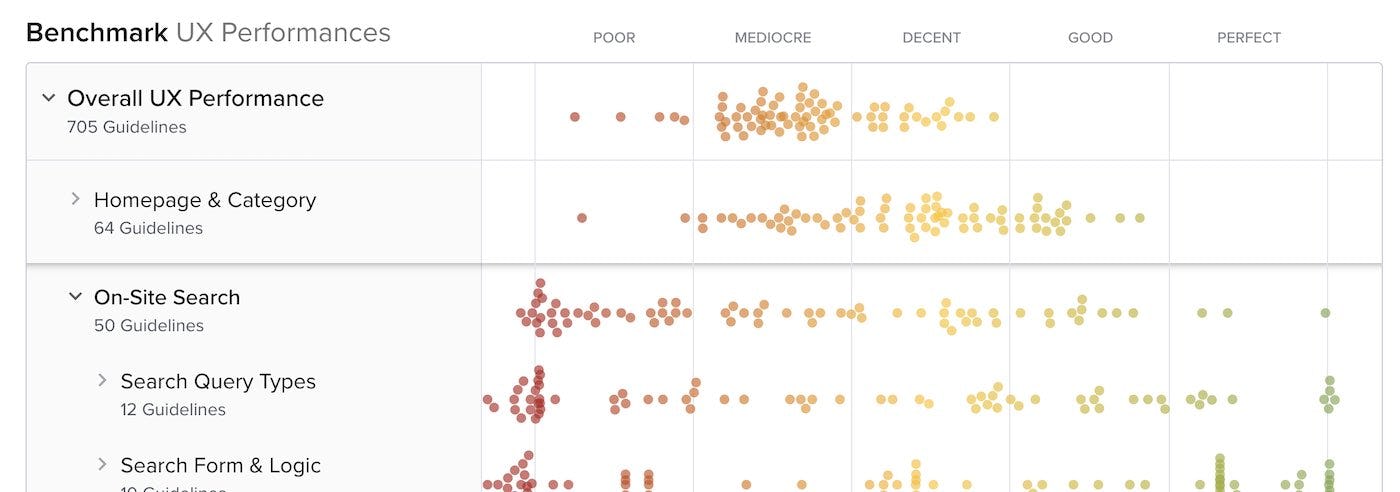
To accompany the checkout usability test sessions we’ve also benchmarked the checkout flows of 177 top grossing US and EU e-commerce sites across all 134 guidelines, each on a 7 point weighted scale. This has resulted in a benchmark database with 7,800 checkout elements manually reviewed and scored, across 440 different checkout steps.
When looking at the general state of checkout usability, the average performance is “mediocre”. The average site has 39 unique improvements to perform in their checkout flow, to gain the 35.26% increase in conversion rate our combined usability test sessions show that the average large-scale e-commerce site can potentially improve through better checkout UX. However, the nuances and diversities behind the overall mediocre performance are manyfold.
Tip: read the full analysis of the above checkout UX benchmark dataset in our article “The Current State of Checkout UX - 18 Common Pitfalls & Checkout Best Practices“.
This is a sub-set of the full benchmark which includes 177 e-commerce sites.
View our full UX benchmark
·
17 Research Reports on Checkout UX
PAID RESEARCH CONTENT
All 134 checkout research findings are available as part of Baymard Premium, and are divided into the following 17 topics (611 pages of research findings in total):
What's Your Reaction?


![[VIP] Nielsen Norman Group: Reports & Books](https://design.rip/uploads/cover/blog/nngroup-reports.jpeg)

